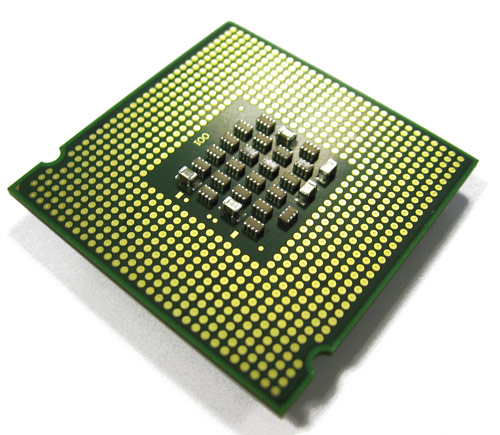
Machine A (Intel 82573L) Xeon 2.6Ghz
Machine B (Intel 82574L) i7 2.6Ghz
Thus the Machine A is a generation or two behind Machine B in both CPU and NIC but thats what we have to work with.
First up is the Send histograms, in both directions A->B and B->A
Machine A send
Machine B send
As you can see Machine B kicks Machine A`s ass by the tune of say, 5-600ns. How much of this is NIC generation and how much is CPU generation is unclear, no doubt both contribute.
And on the other side, Recv first B->A and A->B look like(below)
Machine B recv
And again we see Machine B kicking Machine A`s ass not quite x2 improvement but not far off!. In anycase it looks far better than the Realtek histograms which were... just abysmal and we`ve now got a baseline to work with.
Next up is looking at the round trip latency meaning A->B->A which assuming the network switch dosent suck(too much.... its old) we should expect around 1300ns(A send) + 500ns(B recv) + 750ns(B send) + 900ns(A recv) totaling in ... around 3450 round trip - quite a long time really.
Lets see what it clocks in as.


What benchmarking software do you use generate the numbers or is it something you knocked up yourself? The graphs look like gnuplot - is that correct?
ReplyDeleteits custom everything, except plotting software - using GLE http://glx.sourceforge.net/
ReplyDelete