Monday 22 August 2011

"The Wall"

Found a just classic example of the problem currently fighting with, an uptick which all signals says GO but has the crap beaten out of it by some freight train.

Below is the best bid
Red circle is where the strategy correctly predicts an uptick, but as you can see it promptly gets hammered down. So lets look at the qty open at the best bid, first thing you notice is this massive bid qty spike, kind of like a train heading towards a brick wall. 

Above is the open qty at the best bid, where its clearly visible at the previous valley(hmm whats the lingo for this?) someone adds another 10K shares at that price level adding a nice amount of support. Then as expected market uses that support level pushing the price up again.


Above is open bid at levels 1, 2, 3 away from the best bid. As the best bid price moves up can clearly see "The Wall" moving away then returning until it becomes the best bid again.

At this point would expect the price to bounce back up as there`s support, but what actually happens is this.


Above plots are 4 signals, best bid price(one close + really closeup) with red circle where expect the price to bounce back up. 2nd is the open quantity at the best bid, and 3rd is the cumulative execution qty at that price level.

This is whats frustrating, whats happening is "The Wall" returns (in red), price jumps 1 tick then.. someone decides to hit the entire best bid, knocking the price down again, then continues to eat chunks of 10K shares at that price level (red, blue purple) - the price I thought no one was interested in... Probably the most interesting thing is not that someone hit the bid, but whoever is buying continues to replenish with 10k shares! And thus the reason half my orders just beat the spread, with gross PnL 0/net PnL neagtive hmm...

If you read all the trading books and what not, the less technical ones really push "whos on the other side of your trade" e.g. who are you trading against and whats their psychology/motives/brand of coffee/star sign/phase of the moon or whatever. So with that said, probably the most important question here is, is it man or machine? e.g. is this some crazy ass trader thumping 10k shares buy/sell button on a workstation? or is this algos at play.

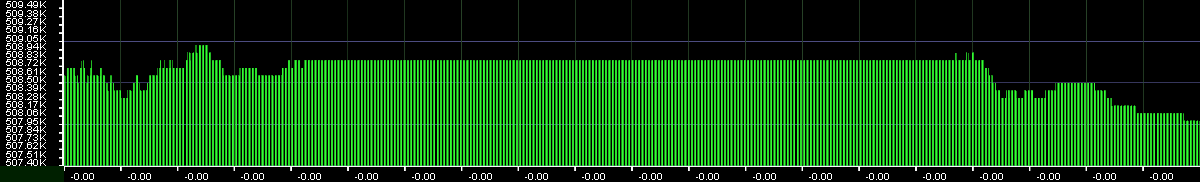
Above is the delta time between quotes for the above sequence, where vertical axis is time in nanosecconds. As you can see theres this huge chunk of black in the middle with some fairly high peeks, one  goes all the way to around 500msec. But this whole sequence is on the order of 1seccond or so. I guess its possible the seller is human but would have to be really quick to pull this off, i mean *really* fast, which is possible but I think unlikely seller is clicking some GUI button here. The buyer on the otherhand is clearly an algo.


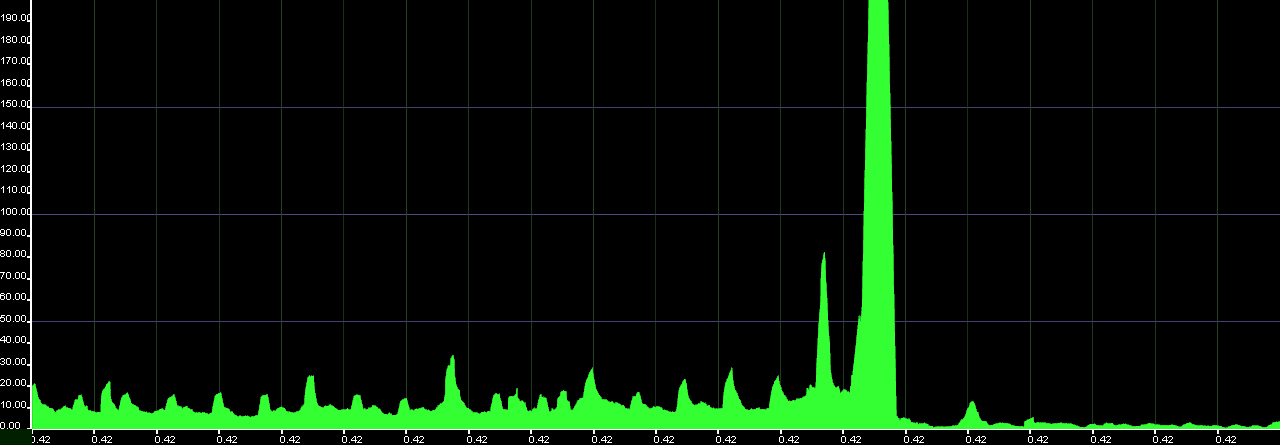
Above is zommed in time delta between quotes/trades in the same time series as the above, 100K on vertical is 100usec. Where we can see the bid qty for "The Wall Part2 & Part3" happens within in a few MSec of the executed order... which has to be a machine. 

... hmm so how to model this...


Friday 19 August 2011

Not loosing, is not winning - transaction costs.

Been a few days since the last post as just hammering away at microstructure strategies which is dam fun but frustrating at times - starting from 0 with nothing/nobody to learn from. Found some nice trigger happy strategies that does *not loose* 90% of the time with Sharpes in the double digits but... there lies the problem, theres 3 states(win, loss, draw) not 2. A "draw" e.g you correctly predict a 1 tick up/down swing where the spread is 1tick happens 45% of the time with win (> 1tick) the remaining 45%. Meaning you end up with gross 0 PnL for 45% of trades as your just beating the spread. Then accounting for transaction costs puts it into net negative PnL 65% of the time (draw + loose) and thus unprofitable - teh sucks dude.

For reference transaction costs are:
- $0.0045/share (broker fee)
- $0.0030/share (nasdaq remove liquidity fee)


Whats happening? its predicting correct movement very well except that movement is rejected (as in basketball reject) half the time as everyone jumps on the first uptick aka mean-revision and knocks the price down 1 tick. So... need to better classify the rejected jump shots from the high Sharpe slam dunks.

...the expedition continues.

Friday 12 August 2011

the opening spam

Been poking around looking at how the market moves and thought would share a "how to spam the open" session.

First the plots, where everything is in "tick time" e.g one X unit is 1 tick. .. we have the best bid
.. and best ask
Next up is how far away from the best bid the tick is (zero if tick is a sell)
.. and the other side
finally the time delta between ticks (in nanosecconds)
As you can see the closer it gets to the opening bell the harder it bursts, and the further away from the best bid/ask it bursts. But... is it adding or removing shares at that price level?
Above is the share delta for ticks on the buy side, where positive is adding shares to the book at that price level - clearly its adding.
... and the same for the sell side, also clearly adding (positive share delta).

So whats it doing? clearly its layering orders vertically across the entire book, presumably at prices that would be very attractive should they get matched - e.g. highly passive strategy. But... why so close to the opening bell? Guessing theres also a spamming component to this. Where if theres 50K ticks in the queue to process, all at different price levels your orderbook has no choice but to update everything and thus, quite possibly, delay your snapshot of the world by 100`s of ticks after the first execution. 

Fantasy? not sure but there`s a very clear and distinct pattern/strategy going on here.

Monday 8 August 2011

bid zappper

been watching the nasdaq crop circles of the day for a while now

http://www.nanex.net/FlashCrash/CCircleDay.html

which is pretty cool, but whats more cooler is seeing it in your own app. What the nanex guys call repeaters which just toggle the best bid constantly for a bit is clearly visible in the following plot

This is the qty of shares open on the best bid, where someone is sending new/delete/new/delete repeatedly in a quite a short time span as can see in the next plot that shows the time delta between price level ticks (this ignores any tick not at the best bid)

Where its averaging around 100usec per change, certainly not the fastest you can do that but still thats alot of ticks a sw feedhandler to decode/process/update then analyze etc etc. Whats interesting is it seems to stop after it gets an execution at the offer.
... trying to rattle some change loose? its possible some less sophisticated algo would count the number of ticks or changes in best price/qty as an input signal to the short term direction of the market? as such they burst a bunch of activity that fools the other trade algo the bid/ask will move in an unfavorable direction thus, it grabs some qty at the bid/ask. How plausible is it? not sure but possible i guess.


Friday 5 August 2011

the bb fuzzzzz

Previously, we did a highlevel overview of market data burst rates, which is kinda cool but how does that translate to bids/offers/price/blah? the answer... it depends but does give an general feel for how fast the market moves.

First up an overview of my symbol for the day.. MSFT... so bring it on.

First up best bid over the day (yeah.. dont think its trading at $38.. got some sort of bug there)
Time delta between new best bids
And cumulative time over the trading session, which isnt so intuitive - horizontal axis is change in best bid, vertical axis is time since midnight in nanosecconds

Its kind of interesting as can see the general shape of the level ticks, the constant fuzzz on the best bid. Probably the most interesting thing at this level is the clearly visible steps and curve of the cumulative time. With the pre open step, few steps towards market open, the long flat string of activity at the open then slowing down during the middle, where as you can see the slight curve near the end. What i find interesting is the bursting near the close is quite different than the open - seems theres less changes in the best bid/offer but needs further investigation.

At the micro level it gets far more interesting, as can start to see micro structure algos at play,, how fascinating! Lets zoom in on some fuzzzzzzz

(note, these are all aligned horizontally in time, eg left bars are all the same tick for all 3 plots)

Where its pretty obvious the best bid is oscillating by 1cent

...and the time delta between price level changes.
where can see the fuzz in the middle has new price levels every ~50usec (vertical axis is in nanoseconds), which is pretty dam quick. Remember these are *new* best bid on the horizontal axis and not the raw ticks. e.g. when a new better price level is seen, or an existing price level is destroyed.

.. and to give it a bit more color heres the cumualtive time which puts it more into perspective.
...the fuzzzzz plateu is clearly visible - remember vertical axis is time.

So whats the fuzz doing? either generating noise on the best bid/offer in an attempt to fool other algos theres a new price level? possibly. Or could be the famous iceburg/pegged orders where you only display a fraction of shares, then replenish the bid/offer when someone grabs em. My guess is the latter here, easy test is add executed quantity but..fun for some other  day.

.. and dam need to fix those axis bugz.

Wednesday 3 August 2011

b-b-b-b-b-bursting

As we saw in the previous post, the tick datarates appear to be pretty low end, to the point where - why cant you subscribe to nasdaq level2 marketdata over your home DSL? hmm.. the answer? its all about bursting.

Take an ITCH new order tick without MPID of say, 31Bytes and lets say double it to 64Bytes, and use a time period of 1second. Resulting in

1000e6(1Gbit) / 8 (bits->bytes) / 64 (our tick) ~= 1.9M new orders per second.

hypothetically say, each order is 100shares @ $5USD  resulting in

1.9M * 100 *5 ~= $950M usd / seccond

 ... so around $1Bn usd / second of new orders... which is crazy for any sustained period of time.

6.5H * 60min * 60 sec * $1Bn ~= $23,400Bn USD / day
...just pocket change.

Thus enter the burstyness of trading.

If we change the timebin to count burst rate over a sliding window of 100usec instead of 1second, then the picture becomes much clearer. Keep in mind the graph samples @ 10msec taking the peek burst rate of that slice (10,000usec/100usec) e.g 100 samples and plots it.

.. and it starts to get more interesting. Here we can see during trading hours its typically bursting at around a more expected 500Mbit/sec
occasionally peeking at the 1000Mbit/sec

Market open also becomes more intense, with a boatload of 500Mbit/sec bursts at the start
the next step is to reduce the timebin by x10, calculating the max bandwidth of a sliding window of 10usec, over the 10msec sample point

... and see a peek of around 38GBit/sec at market close! hmm.... meaning... I need to confess that im using the nanosec timestamp in the ITCH packet for all these calculations. e.g its software time stamped by NASDAQ and isnt hardware timestamped as it comes down the wire. Yet its still a good estimate of what is being sent.

market open also looks more interesting, with a consistent burst rate in the 5GBit/sec rate. Interestingly its exactly x10 higher than our 100usec time bin.

finally what happens if we use the duration of the last 256packets sent, instead of fixed time window?
Above is maket open, showing the familiar cyclic lumps 30sec/kaboom/relax opening pattern. However if we drill down into the samples theres  some rather interesting behaviour  observed.
... which looks extremely artificial. First thoughts are, this is the garbage collector running on some of the nasdaq servers. Heres a closeup
no idea what kind of software nasdaq runs, but would guess a managed language like C# or java. None the less, as its pretty unlikely all participants on the exchange would suddenly stop sending orders, or send at such a consistent rate that would result in such a plot.

.... and the exercise left to you, the reader, is how do you turn garbage into alpha :P

how fast is fast?

Wow... and back once again after a slight detour through the silicon/carbon composite alloy that is the jungle of finance IT...... So, back to hacking NASDAQ, march on!!

First off with all this talk of HFT and massive compute/ultra low latency/blah its a good idea to step back a bit and say... what is the shape of nasdaqs tick data rate? what kind of throughput/latency we dealing with?

The standard number in networking typically refers to bits/second either Megabit/sec or Gigabit/sec or Terrabit/sec etc that translates to (Total Bytes) / (Timebin in Seconds). Which is great if your looking at throughput e.g. downloading throttling torrentz but for trigger-happy-on-the-razors-edge-pants-on-fire trading systems such number is completely useless, as we will see shortly.

None the less lets start off nice and slow and look at some random day on nasdaq this year, specifically 2011/4/11. Each sample here is 10ms, using the peek bandwidth over a sliding window of 1second.

For reference

Bytes = Ethernet frame(12B) + IPv4 frame(20B) + UDP frame(8B) + SoupBin + ITCH length

eg  the numbers include the full protocol/framing overhead up to ethernet but not including xaui/sgmii/layer1 overhead or accounting for interframe gaps

NOTE: all graphs vertical axis is Mbit/sec
Which is kinda boring, but can clearly see the auction open(triangle thing), start of matching(first spike), nice smile/dip in activity during lunch and how it picks up again at the close.

There`s a few interesting patterns here, such as the ripples in traffic few seconds before matching starts.


... and the burst of activity just before the close which surprisingly is larger than the open


... zooming in you can see some of the more interesting behaviour / burstyness of the traffic... or perhaps a martian landscape with cacti.


... a more sharper burst


Cool pics but... pftty... it barely peeks at 300Mbit whats the big deal? the answer is - the rates are calculated over a 1second sliding window and 1second is one hell of a long time.